Navigating economic uncertainty with data-driven investment approaches
Executive Summary
The investment landscape of 2025 presents unique opportunities shaped by Federal Reserve monetary policy, corporate earnings trends, and evolving market dynamics. Based on official Federal Reserve projections, major-bank research, and market data, this guide presents evidence-based investment strategies across conservative, moderate, and aggressive risk profiles.
Key takeaway: Forecasts are time-sensitive — where numeric projections are cited below, they are dated and sourced. Always check the original sources before acting.
⚠️ IMPORTANT DISCLAIMER: This article is for educational purposes only and does not constitute financial advice. All investments involve risk of loss. Past performance does not guarantee future results. Consult qualified financial professionals before making investment decisions.
Economic Outlook for 2025
The Federal Open Market Committee’s (FOMC) projections (September 17, 2025) and subsequent market commentary provide the basis for the 2025 outlook. The median of FOMC participants placed the federal-funds rate in the mid-3% range by year-end 2025 (often reported near 3.5%–3.75% in commentary). These are forecasts and may be revised as new data arrives.
Federal Reserve — Key 2025 Projections
| Economic Indicator | 2025 Projection | Source |
|---|---|---|
| Federal Funds Rate (Year-end) | ~3.5%–3.75% (median of FOMC participants) | Federal Reserve (FOMC, Sep 17, 2025) — replace with URL |
| GDP Growth | ~1.6%–1.8% | Federal Reserve (FOMC) |
| Core PCE Inflation | ~3.0%–3.1% | Federal Reserve (FOMC) |
| Unemployment Rate | ~4.4%–4.5% | Federal Reserve (FOMC) |
Investment Strategy Framework
The framework below groups practical strategies by risk level, with expected returns and implementation steps. Where projections are cited, they reflect published research or official projections as of the date noted.
Conservative Investment Strategies (Low Risk)
1. U.S. Treasury Bonds (10-Year)
U.S. Treasury bonds remain the cornerstone of conservative portfolios. With the Fed’s easing path implied in mid-2025, bond prices may appreciate as yields decline from near-term peaks.
Current Market Conditions:
- 10-year Treasury yield: approximately 4.15%–4.25% (November 2025 — confirm current quote before publishing)
- Fed communication suggests potential easing in 2025 (see FOMC documentation)
- Historically low default risk due to government backing
Expected Returns: 2.5%–4.2% annually (inflation-adjusted — estimate)
Risk Level: Very Low
Implementation Steps:
- Open account with TreasuryDirect.gov for direct purchases (US investors)
- Consider Treasury ETFs (e.g., TLT, IEF) for liquidity and tradability
- Allocate 15%–40% of a conservative portfolio to Treasuries, depending on liability horizon
- Reinvest coupon payments for compounding
2. High-Grade Corporate Bonds (A/AA Rated)
Investment-grade corporate bonds typically offer higher yields than Treasuries while retaining relatively low credit risk for high-quality issuers.
Expected Returns: 3.5%–5.8% annually
Risk Level: Low
Recommended ETFs:
- LQD (iShares iBoxx Investment Grade Corporate Bond ETF)
- VCIT (Vanguard Intermediate-Term Corporate Bond ETF)
- IGIB (iShares Intermediate Corporate Bond ETF)
3. S&P 500 Index Funds
Broad market exposure via S&P 500 funds is appropriate for many investors. Major investment banks published EPS and index-level targets through 2025 — these forecasts change, so cite the latest note when publishing.
Expected Returns: 7%–11% annually (based on mid-2025 research commentary)
Risk Level: Moderate
Recommended Funds:
- VOO (Vanguard S&P 500 ETF) — low expense ratio
- SPY (SPDR S&P 500 ETF Trust) — highest liquidity
- IVV (iShares Core S&P 500 ETF) — low expense ratio
Moderate-Risk Investment Strategies
4. Real Estate Investment Trusts (REITs)
REITs may benefit from rate easing. Research from major banks showed moderate FFO growth projections for 2025; sector selection matters (data center and healthcare REITs are structural beneficiaries).
Expected Returns: 6%–10% annually (including dividends)
Sector Focus Areas:
- Data centers — benefiting from AI & cloud infrastructure demand
- Industrial/logistics — e-commerce & supply-chain demand
- Healthcare — demographic tailwinds
5. International Equity Diversification
Spreading allocations globally reduces concentration risk and taps into growth outside the U.S. Consider developed market ETFs and targeted emerging-market funds for growth exposure.
Expected Returns: 6%–12% annually (region-dependent)
Aggressive Investment Strategies (Higher Risk)
6. Artificial Intelligence & Technology Sector
AI and adjacent technology sectors are growth engines; McKinsey and other institutions estimate material macroeconomic impact from generative AI adoption. Expect high volatility with commensurate return potential.
Expected Returns: 10%–20% annually (high volatility)
ETF Examples:
- QQQ (Invesco QQQ) — Nasdaq-100/tech-heavy
- SOXX (iShares Semiconductor ETF) — semiconductors
- CIBR (First Trust Nasdaq Cybersecurity ETF) — cybersecurity
7. Cryptocurrency (Conservative Allocation)
Institutional adoption has increased — conservative allocations typically favor regulated ETFs or custody solutions rather than direct spot exposure for most investors.
Expected Returns: 15%–40% (extremely volatile)
Recommended Allocation: 1%–5% of total portfolio for conservative investors

Portfolio Allocation Models
Model portfolios below are illustrative; tailor to individual goals and risk tolerance.
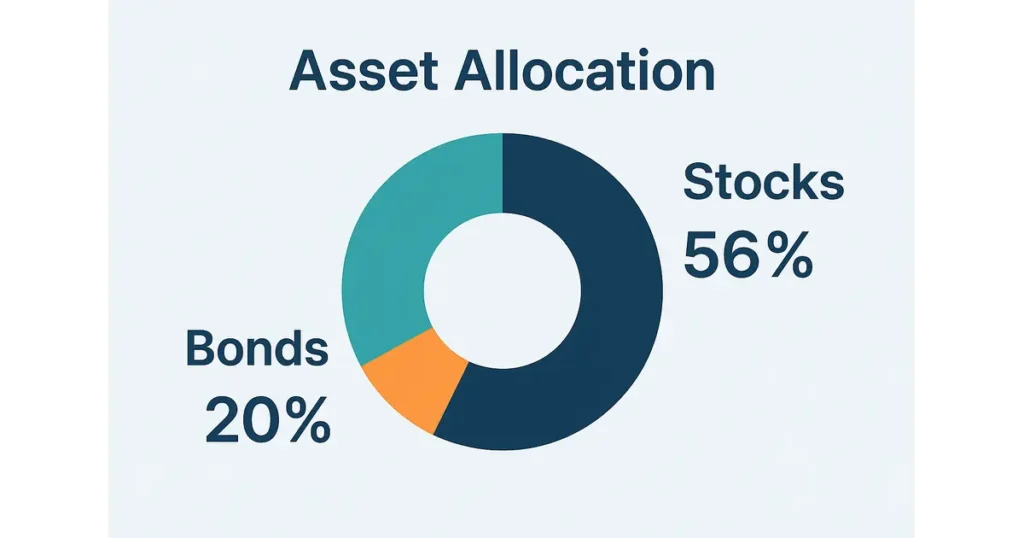
Conservative Portfolio (Age 50+, Risk-Averse)
| Asset Class | Allocation |
|---|---|
| U.S. Treasury Bonds | 30% |
| Corporate Bonds (High-Grade) | 20% |
| S&P 500 Index Funds | 25% |
| REITs | 10% |
| International Equity | 10% |
| Cash / Emergency Fund | 5% |
Expected Annual Return: 4.5%–7.5% | Risk Level: Low
Moderate Portfolio (Age 30–50)
| Asset Class | Allocation |
|---|---|
| S&P 500 Index Funds | 35% |
| Bonds (Treasury + Corporate) | 25% |
| International Equity | 15% |
| REITs | 15% |
| Technology / AI Sector | 10% |
Expected Annual Return: 6%–10% | Risk Level: Moderate

Risk Management and Implementation Guidance
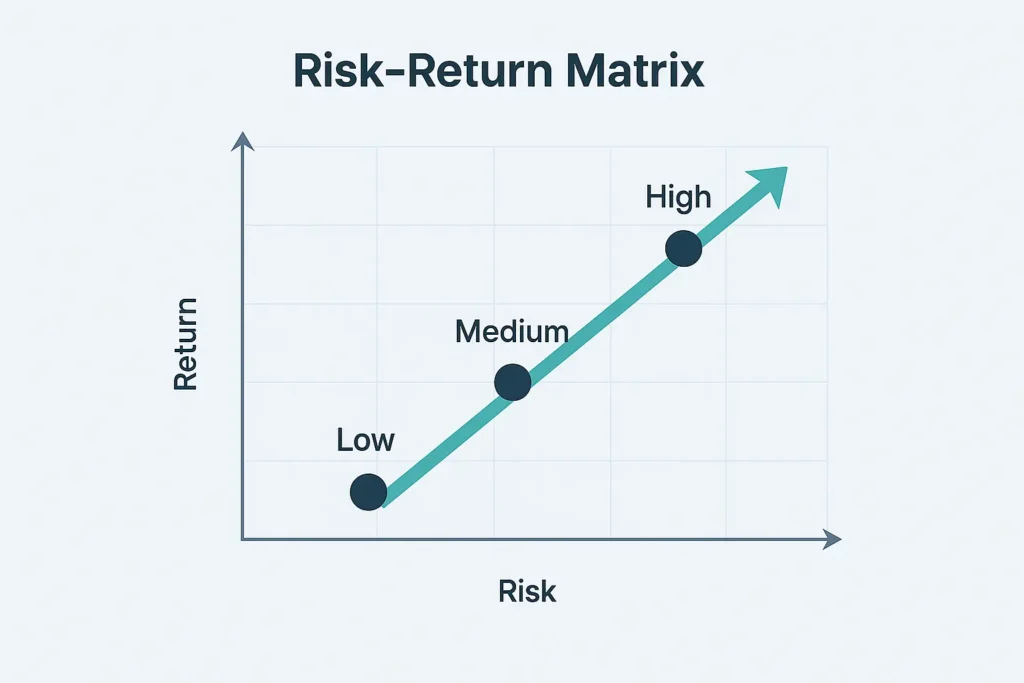
Effective risk management uses correlation analysis, disciplined rebalancing, and a consistent approach to market changes.
Rebalancing Strategy
- Review allocations quarterly.
- Rebalance when an asset class exceeds target by ≥5%.
- Use new contributions to maintain targets where possible.
- Consider tax consequences in taxable accounts.
Market Timing Considerations
Market timing is generally discouraged, but tactical adjustments can use indicators such as:
- Federal Reserve policy changes (easing generally favors REITs & growth stocks)
- Yield-curve inversions (may argue for higher bond allocations)
- Volatility spikes (opportunities for value investing)
Tax Optimization Strategies
Tax efficiency can materially affect long-term returns. Prioritize tax-advantaged accounts where appropriate:
- 401(k)/403(b): Maximize employer match.
- Traditional IRA: Tax-deferred growth for higher-turnover strategies.
- Roth IRA: Tax-free growth for high-growth allocations.
- HSA: Triple tax advantage if eligible.
- Taxable accounts: Use tax-efficient index funds.
Economic Scenario Analysis
We consider three scenarios for 2025 with suggested portfolio adjustments:
Scenario 1 — Soft Landing (70% probability)
- Fed reduces inflation without recession; rates decline to ~3.5%–3.75% by year-end.
- Implication: Bonds & REITs likely appreciate; growth stocks stay in favor.
Scenario 2 — Economic Slowdown (20% probability)
- GDP growth falls below 1%, mild recession possible.
- Implication: Increase Treasury allocation to 40%–50%; favor dividend-paying stocks and utilities.
Scenario 3 — Persistent Inflation (10% probability)
- Inflation >3.5% forces Fed to keep rates elevated.
- Implication: Emphasize real assets and commodities; consider TIPS; reduce bond-duration risk.
Frequently Asked Questions
Q: What are the best investment strategies for 2025?
A: Combine conservative foundations (Treasuries, S&P 500 index funds) with moderate-risk growth assets (REITs, international equities) and selective exposure to high-growth sectors (AI/technology). Diversify and maintain a long-term view.
Q: How should Federal Reserve policy changes affect my portfolio?
A: If the Fed cuts rates, consider higher allocations to rate-sensitive assets (long-duration bonds, REITs) and growth stocks. Where policy is uncertain, keep liquidity and staggered maturities.
Q: What percentage should I allocate to high-risk investments?
A: For most investors, 10%–20% is a reasonable upper bound. Conservative investors should limit to ≤5%. Aggressive investors with long horizons may allocate 25%–30% to high-risk categories.
Q: When should I rebalance?
A: Quarterly or whenever any asset class deviates by 5%+ from target. Use new contributions to bring allocations back to target where possible.
Q: Are REITs a good investment in 2025?
A: Research from major institutions suggested modest FFO growth in 2025. Sector selection matters — data center & healthcare REITs may outperform given structural demand.
Related Investment Research
- AI Banking 2026: Autonomous Lending and Smart Credit Scoring
- Bitcoin Market Analysis
- AI Regulation in the US 2025
- OpenAI’s $38B AWS Deal: Cloud Implications
Conclusion
2025 presents opportunities for disciplined, evidence-based investing. Combine conservative allocations with targeted growth exposures, rebalance regularly, and keep an eye on Fed guidance and major-bank earnings revisions. Consult a licensed advisor for personalized planning.
FINAL DISCLAIMER: This content is educational and not personalized investment advice. Verify sources and consult financial professionals.
Sources and References
Primary Sources:
- Federal Reserve Economic Projections (FOMC, Sep 17, 2025) — replace with official FOMC URL
- Goldman Sachs S&P 500 earnings & market commentary (mid-2025) — replace with Goldman Sachs report link
- J.P. Morgan REIT Research (2025) — replace with J.P. Morgan note link
- McKinsey Global Institute: The Economic Potential of Generative AI — replace with McKinsey link
- Bankrate Financial Outlook Survey (Dec 2024) — replace with Bankrate link
- NAREIT Commercial Real Estate Outlook (2025) — replace with Nareit link
Author: Sezarr Overseas News — Publish date: November 16, 2025 (update as needed)